Your Time has Finished
Loading...
BMAT 2009-S1
Your Score: %
Average Score of All Users:
You performed better than of students
Section Breakdown
| Your Score | Average of all Users | Percentile | |
|---|---|---|---|
| BMAT 2009 S1 |
BMAT 2009 S1
Your score:
Average score:
You performed better than of students
This section is Section 1 of 3.
Speed as well as accuracy is important in this section. Work quickly, or you might not finish the paper. There are no penalties for incorrect responses, only marks for correct answers, so you should attempt all 35 questions. Each question is worth one mark.
You must complete the answers within the time limit. Calculators are NOT permitted.
Good Luck!
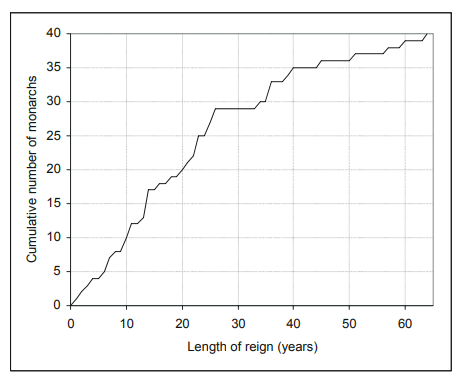
The graph below is a cumulative plot of the length of reigns of British kings or queens from 1066 to the present. The vertical axis shows the number of monarchs who had reigned for less than the number of years plotted on the horizontal axis.

Explanation
The correct answer is C(15).
Looking at the part of the graph between x=20 years and x=40 years, we can see that these positions on the x-axis correspond to values of 20 and 35 monarchs respectively. As the y axis shows the cumulative frequency, the number of monarchs who reigned for 20 years or more but less than 40 years can be calculated by 35-20=15