Your Time has Finished
Loading...

Official TSA Tabular Questions (2008-2019)
Your Score: %
Average Score of All Users:
You performed better than of students
Section Breakdown
| Your Score | Average of all Users | Percentile | |
|---|---|---|---|
| Official TSA Tabular Questions (2008-2019) |
Official TSA Tabular Questions (2008-2019)
Your score:
Average score:
You performed better than of students
Speed as well as accuracy is important in this section. Work quickly, or you might not finish the paper. There are no penalties for incorrect responses, only marks for correct answers, so you should attempt all questions. Each question is worth one mark.
Calculators are NOT permitted.
Here you will find all TSA Tabular questions that have been written 2008-2019.
The table below shows the unemployment rate and percent change in industrial production over the last year for several countries.
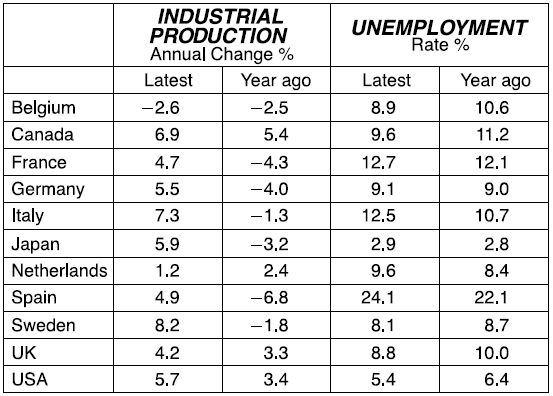
Explanation
The correct answer is B.
We only need to look at the parameters for the UK and the 5 other countries given as options A-E. The percentage increase in industrial production for the UK is 4.2-3.3=0.9.This change is actually a decrease for Belgium, so eliminate A. There percentage increase in industrial production for Canada, France, Italy and the USA were 1.5, 9, 8.6 and 2.3 respectively, which are all greater than the percentage change for the UK, so no more answers can be eliminated at this point. The fall in the percentage unemployed than the UK over the last year was: 10-8.8=1.2. For Italy the percentage unemployed actually increased by 1.8%, so eliminate D. For Canada, France and the USA this value was:1.6, 0.6 and 1.0 respectively. Therefore only Canada has had a larger percentage increase in industrial production and greater fall in the percentage unemployed than the UK over the last year.