Your Time has Finished
Loading...
BMAT 2011-S1
Your Score: %
Average Score of All Users:
You performed better than of students
Section Breakdown
| Your Score | Average of all Users | Percentile | |
|---|---|---|---|
| BMAT 2011 S1 |
BMAT 2011 S1
Your score:
Average score:
You performed better than of students
This section is Section 1 of 3.
Speed as well as accuracy is important in this section. Work quickly, or you might not finish the paper. There are no penalties for incorrect responses, only marks for correct answers, so you should attempt all 35 questions. Each question is worth one mark.
You must complete the answers within the time limit. Calculators are NOT permitted.
Good Luck!
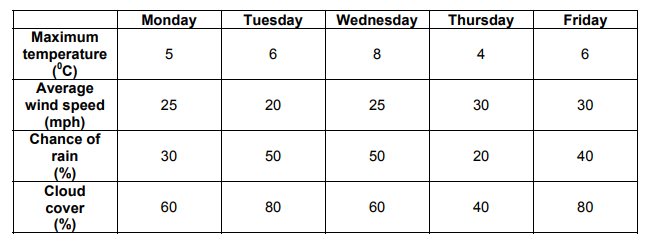
The weather forecast for a five day period is summarised in the table below:

For each of the rows of the table one of the bar charts A to E could represent the data if it were suitably labelled.
Explanation
The correct answer is D.
For maximum temperature, Wed’s bar should be the tallest followed by Tue’s and Fri’s which will be the same height as each other. This is shown by graph E.
For average wind speed, Thu’s and Fri’s should be joint tallest, followed by Mon and Wed which are joint second tallest. This is shown by graph C.
For chance of rain, Tue and Wed should be joint tallest, followed by Fri. This is shown by graph B.
For cloud cover, Tue and Fri should be joint tallest, followed by Mon and Wed. This is shown by graph A.
Therefore the only bar chart that does not represent a row in the table is graph D.