Your Time has Finished
Loading...
BMAT 2014-S1
Your Score: %
Average Score of All Users:
You performed better than of students
Section Breakdown
| Your Score | Average of all Users | Percentile | |
|---|---|---|---|
| BMAT 2014 S1 |
BMAT 2014 S1
Your score:
Average score:
You performed better than of students
This section is Section 1 of 3.
Speed as well as accuracy is important in this section. Work quickly, or you might not finish the paper. There are no penalties for incorrect responses, only marks for correct answers, so you should attempt all 35 questions. Each question is worth one mark.
You must complete the answers within the time limit. Calculators are NOT permitted.
Good Luck!
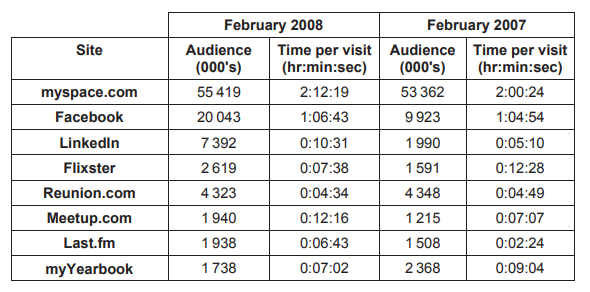
The table below shows ‘audience numbers’ and ‘time per visit’ for a number of popular social networking sites. A comparison of figures for the month of February is shown for two consecutive years.

Explanation
The correct answer is D.
For this question, take care to read the table in an L shape to identify little tricks such as the fact that the right column is 2007, and the left is 2008. This is deeply counterintuitive, and a horrible way to make a table, but such is the BMAT. Then, check the websites which have had both an increase in audience and time per visit. It is sensible to eliminate and put a cross next to those which do not have an increase in one or the other as you go, to keep track. We see that MySpace, Facebook, LinkedIn, Meetup.com and Last.fm all had increases in both parameters, so D is the correct answer.
Top tip!
Read tables in an ‘L’ shape to identify the headings and not fall into traps of layout!