Your Time has Finished
Loading...

GAMSAT Section I – Diagrams + Data Interpretations
Your Score: %
Average Score of All Users:
You performed better than of students
Section Breakdown
| Your Score | Average of all Users | Percentile | |
|---|---|---|---|
| Diagrams + Data Interpretations |
Diagrams + Data Interpretations
Your score:
Average score:
You performed better than of students
Speed as well as accuracy is important in this section. Work quickly, or you might not finish the paper. There are no penalties for incorrect responses, only marks for correct answers, so you should attempt all questions. Each question is worth one mark.
You must complete the answers within the time limit. Calculators are NOT permitted.
Good Luck!
Explanation
The correct answer is B.
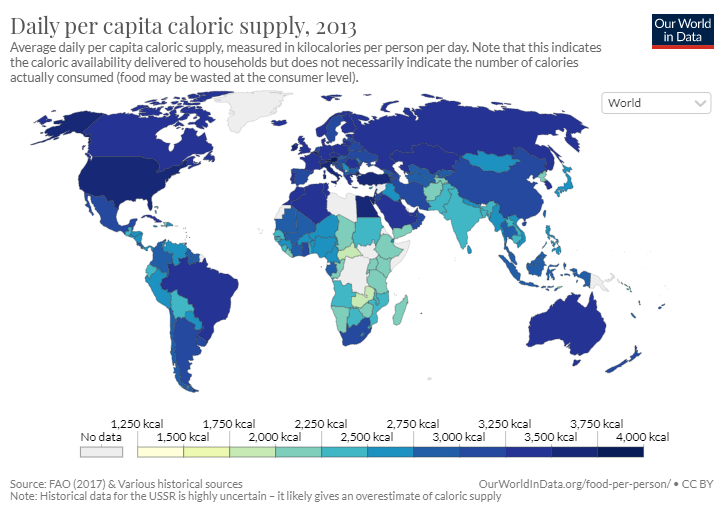
This is a graph demonstrating daily per capita caloric supply. The important thing for candidates to look at is the word ‘supply’, ignoring this would lead candidates to most likely choose an answer looking at calorie consumption. The graph is looking at the amount of calories available per capita per day across the world.