Your Time has Finished
Which UCAT Exam
are you sitting?
Loading...

QR Graph Questions
Your Score:
Average Score of All Users:
You performed better than of students
Section Breakdown
| Your Score | Average of all Users | Percentile | |
|---|---|---|---|
| Graph |
Graph
Your score:
Average score:
You performed better than of students
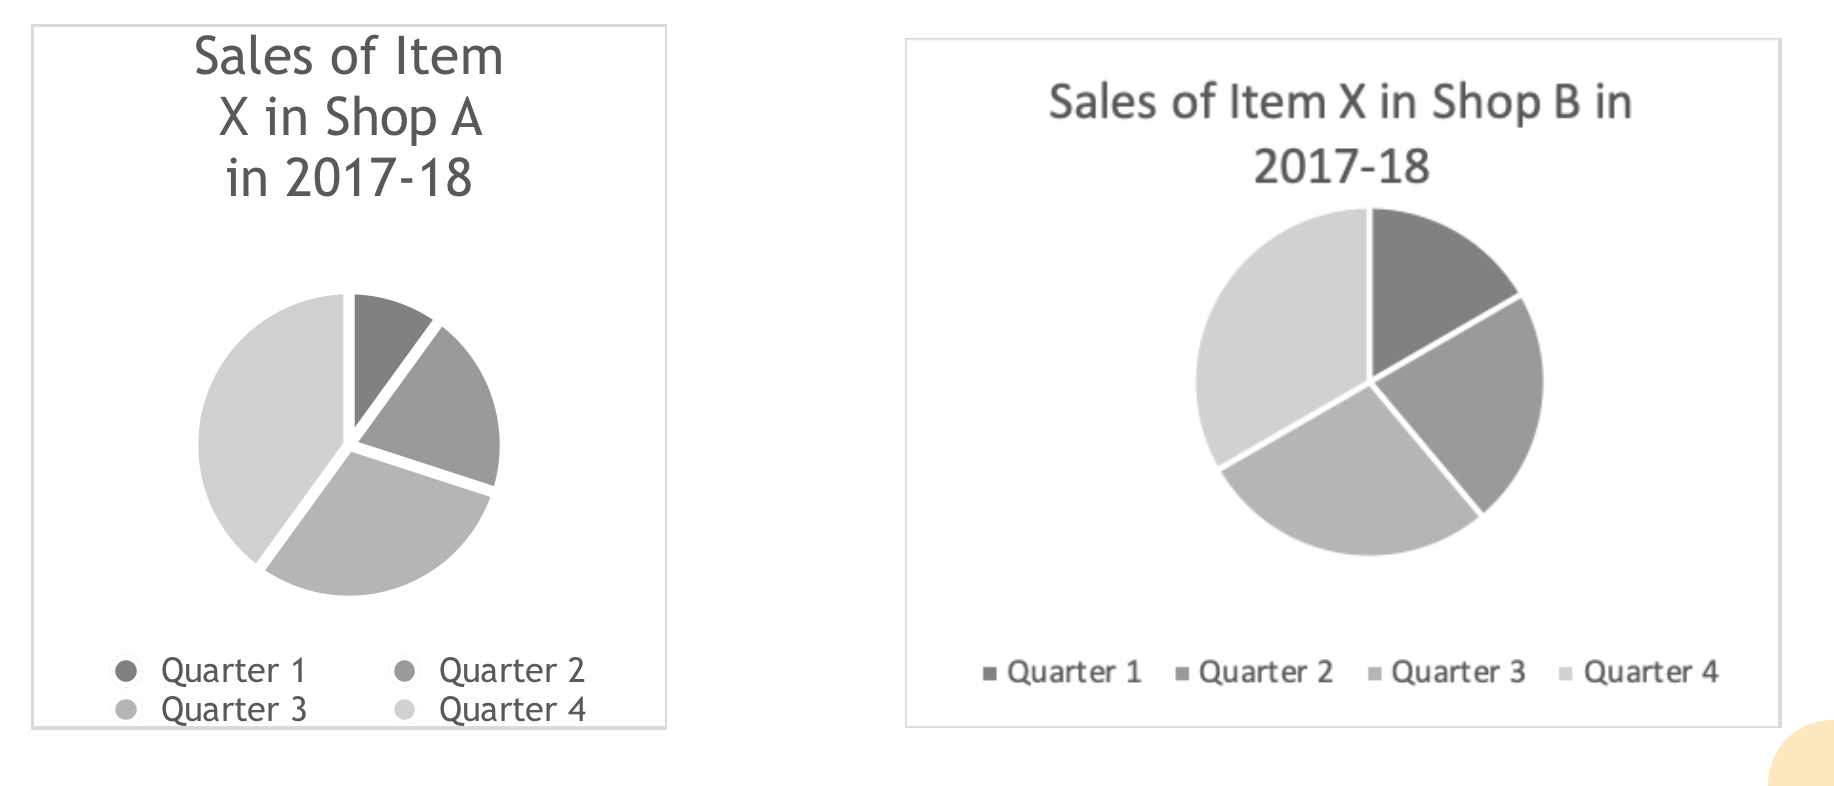
Item X is the best-selling new sous vide circulator that every wannabe home-chef wishes to own. It has seven speeds and can be controlled from a mobile app. The product has received rave reviews – appearing in the QG magazine of ‘Top Ten Kitchen Items Any Gentleman Should Own’.
Sales of Item X in Shop A in 2018-19
|
Quarter |
Sales |
|
Q1 |
75 |
|
Q2 |
100 |
| Q3 |
250 |
| Q4 |
175 |
Explanation
Answer: E
Explanation: Without information on the total number of sales, we cannot compare the pie charts. Thus, the claim that the sales were higher in Shop A than Shop B cannot be supported as we only know that the sales were a higher proportion of the whole year in Q1 in Shop A rather than being a higher number sold.
Top Tip: Remember that pie charts cannot be compared if we do not know the total number of items sold. 33% of 2 is smaller than 20% of 2000.
Item X is the best-selling new sous vide circulator that every wannabe home-chef wishes to own. It has seven speeds and can be controlled from a mobile app. The product has received rave reviews – appearing in the QG magazine of ‘Top Ten Kitchen Items Any Gentleman Should Own’.
Sales of Item X in Shop A in 2018-19
|
Quarter |
Sales |
|
Q1 |
75 |
|
Q2 |
100 |
|
Q3 |
250 |
|
Q4 |
175 |
Explanation
Answer: E
Explanation:
1. Find the total sales in each quarter for B and compare
We are looking for 2018-19 so it is based on the information in the table:
For percentage difference:
New Value = Original Value x Multiplier
Top tip: For information on how to find a multiplier for a given percentage difference, look at the Medic Mind Lesson on the topic.
For Quarter 1: 33% higher so
New = 75 x 1.33
New = 100
Repeat these calculations for the figures for Q2 to Q4
Q2: 30% decrease – 100 x 0.7 = 70
Q3: 32% increase – 250 x 1.32 = 330
Q4: 44% decrease – 175 x 0.56 = 98
This gives a total of 100 + 70 + 330 + 98 = 598
For Shop A the total is:
75 + 100 + 250 + 175 = 600 – 2 more than in Shop B – answer option A.
Timing Tip: This question has differences in sales of one unit so it is important that you work precisely from the outset.
Fri, 19 Mar 2021 09:22:33
Could someone explain why D is incorrect? We don't know that the sales are higher w/o the total, but we can tell that the % of sales are higher?
Mon, 12 Apr 2021 10:07:13
Answer D is incorrect because there is no information about the year. It just mentions Q4 but not the year.
Sun, 27 Jun 2021 18:06:35
The correct answer is E. A cannot be incorrect just because you don't have full information total. Therefore the best answer would be there is insufficient information to draw any of these conclusions. Which is true since Answer A cannot be determine without further information. Answer E is also correct since Option B and C cannot be answered without further information which is also true for option D which does not specify the year,
Sat, 17 Jul 2021 18:10:16
Can someone please tell me why B is not correct because i thought it is clearly stated that the sales is 250 which is the highest among all of them of item x during 2018-2019, thank you
Fri, 23 Jul 2021 20:59:16
Please could someone explain why option B and why option C are incorrect, because according to the table they appear to be correct.
Thu, 02 Sep 2021 22:34:05
Hi there, since the question is :Which of the following is incorrect, aren't we supposed to be looking for the wrong answer. Therefore if E is the correct answer, it is wrong?
Mon, 13 Dec 2021 19:07:15
Hi there! I am a bit stuck as to why answer A is correct. It states that 'Sales of Item X were higher in Shop A than Shop B in Q1 of 2017-18', but if we look at the pie charts the proportion of Q1 in shop A < than shop B. Also, if the explanation states that 'without information on the total number of the sales, we cannot compare the pie charts' therefore, wouldn't this make both options A and D incorrect?? Thank you :)